
Simple Electricity Network#
Note
You can download the data used in this example.
InfraFair main function has default values that runs this example automatically by pressing enter when it asks for inputs. The network of this example is shown in the figure below. It consists of six countries, thirteen lines, six demand and six generations. The map of flows in this example comprises a single operational snapshot.

Results#
The basic output results consist of the tracked flow on each line to generators and demand, which are stored in the files “Generation agents overall flow contribution per asset.csv” and “Demand agents overall flow contribution per asset.csv”, respectively as shown in the tables below.
- Demand results
Node
1-2
1-3
11-12
2-4
3-4
4-6
5-6
6-8
6-9
7-12
7-8
8-9
9-10
1
500
4500
0
0
0
0
0
0
0
0
0
0
0
2
0
0
0
0
0
0
0
0
0
0
0
0
0
3
0
0
0
0
0
0
0
0
0
0
0
0
0
4
0
0
0
3500
15500
1000
0
0
0
0
0
0
0
5
0
0
0
0
0
0
45000
0
0
0
0
0
0
6
0
0
0
0
0
0
0
0
0
0
0
0
0
7
0
0
0
0
0
0
0
0
0
0
0
0
0
8
0
0
0
0
0
0
0
2983.3
0
0
41016.7
0
0
9
0
0
0
0
0
0
0
289.7
6727
0
3983.3
4273
16000
10
0
0
0
0
0
0
0
0
0
0
0
0
0
11
0
0
0
0
0
0
0
0
0
0
0
0
0
12
0
0
3000
0
0
0
0
0
0
1000
0
0
0
Total flow
500
4500
3000
3500
15500
1000
45000
3273
6727
1000
45000
4273
16000
- Generators results
Node
1-2
1-3
11-12
2-4
3-4
4-6
5-6
6-8
6-9
7-12
7-8
8-9
9-10
1
0
0
0
0
0
0
0
0
0
0
0
0
0
2
500
0
0
3500
0
0
0
0
0
0
0
0
0
3
0
4500
0
0
15500
0
0
0
0
0
0
0
0
4
0
0
0
0
0
0
0
0
0
0
0
0
0
5
0
0
0
0
0
0
0
0
0
0
0
0
0
6
0
0
0
0
0
1000
45000
3273
6727
0
0
289.7
0
7
0
0
0
0
0
0
0
0
0
1000
45000
3983.3
0
8
0
0
0
0
0
0
0
0
0
0
0
0
0
9
0
0
0
0
0
0
0
0
0
0
0
0
0
10
0
0
0
0
0
0
0
0
0
0
0
0
16000
11
0
0
3000
0
0
0
0
0
0
0
0
0
0
12
0
0
0
0
0
0
0
0
0
0
0
0
0
Total flow
500
4500
3000
3500
15500
1000
45000
3273
6727
1000
45000
4273
16000
Warning
Results are exported as .csv files because the format is faster than exporting them as .xlsx. However, the .csv files automatically convert the data format of the cells. Therefore, the name of a line connecting two nodes with ID numbers less than 12 will be automatically converted to date format. This is the case in this example. The header that contains the name of the lines will be displayed as date; e.g., line 1-2 will be displayed as 2-Jan.
To tackle this issue with the .csv files, the user can import the files into Excel using the Data -› From Text/CSV option. During the import process, Excel will allow you to specify the data type for each column. Choose Text for the column that contains values like 1-2. This tells Excel to treat the values in that column as text, and it will not change them to dates.
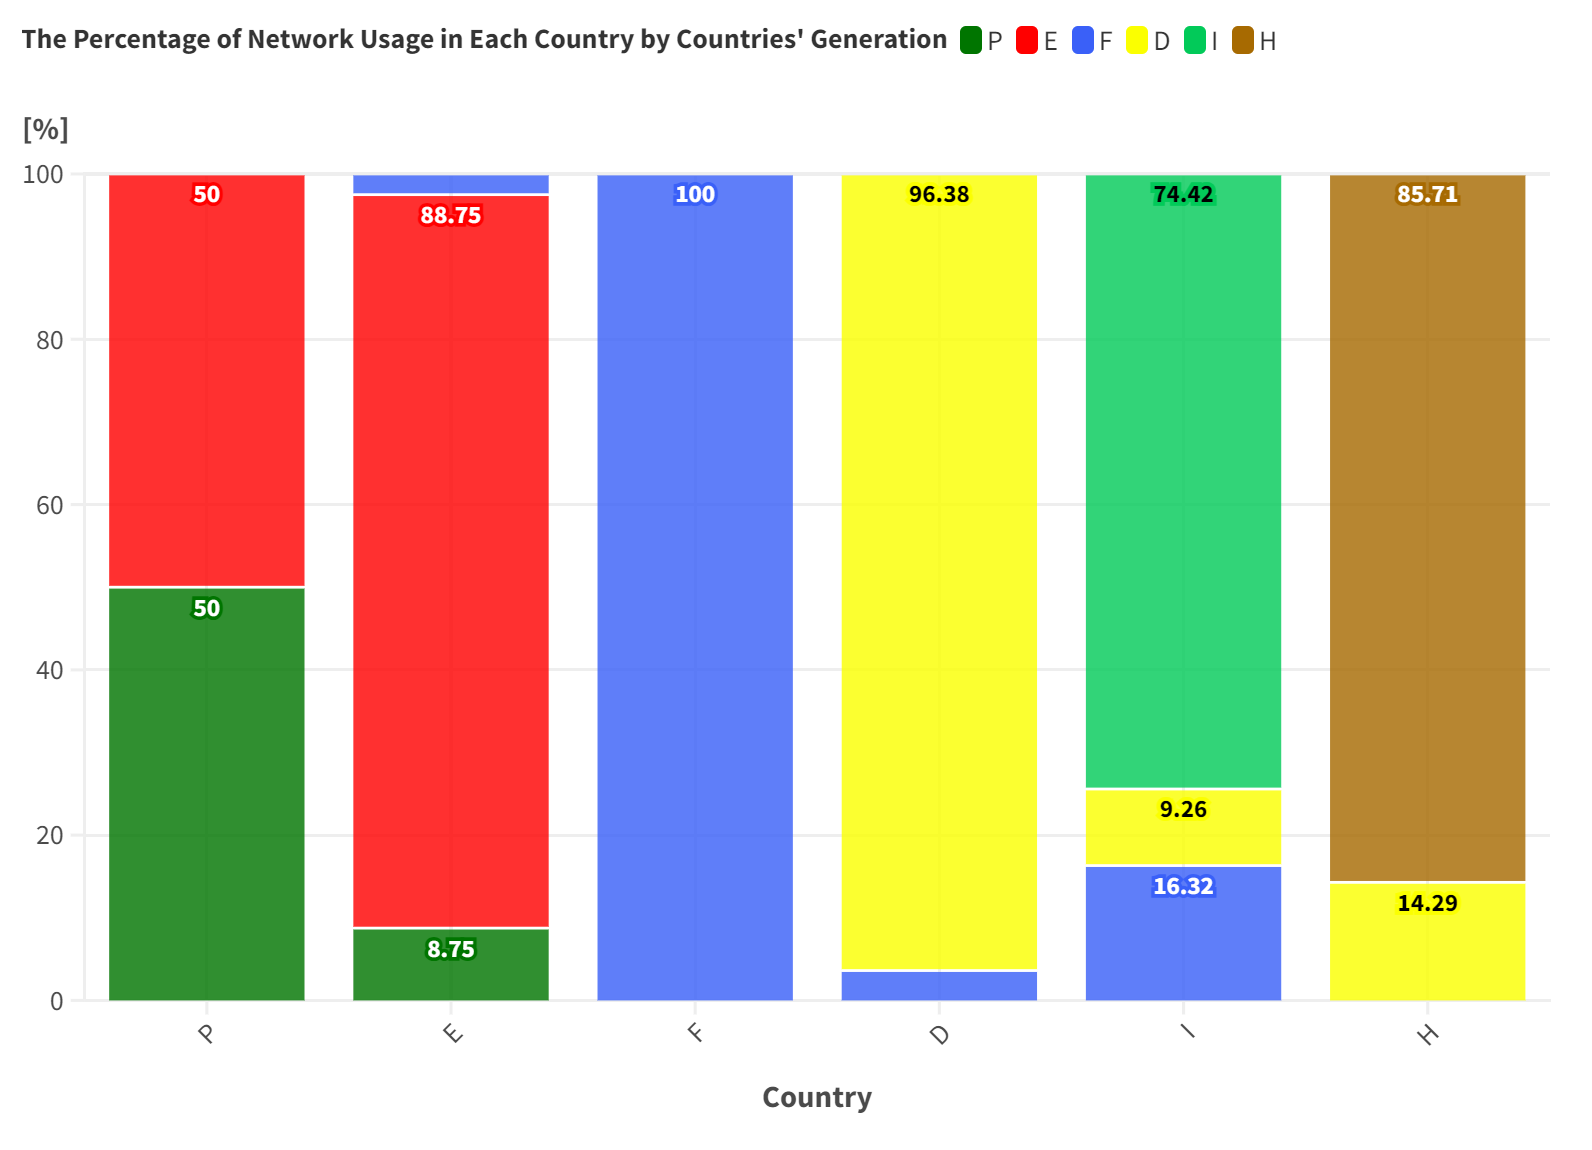
The graphs below were created from the raw results above using Flourish data visualization. They show the percentage of each country’s usage corresponding to the usage made by each country’s demand and generation, separately.

References#
For more details about this example, see:
Olmos, L., & Perez-Arriaga, I. J. (2007). Evaluation of Three Methods Proposed for the Computation of Inter-TSO Payments in the Internal Electricity Market of the European Union. IEEE Transactions on Power Systems, 22(4), 1507–1522. 10.1109/TPWRS.2007.907118