The EU Regional Electricity Network#
Note
You can download the data used in this example.
The network presented in this example represents an old snapshot of the European transmission network that includes eighteen countries, 3383 nodes and 5681 transmission lines. A single operational snapshot is used in this example to trace the flow.
Note that the data included in this example is meant for demonstration purposes and is by no means an accurate representation of the network. All the data included in the Assets attributes tab is artificial, and the cost figures are made up figures for testing purposes only.
Running the Example#
To run the case, follow the following commands.
Launch the command prompt (Windows: Win+R, type “cmd”, Enter) or the Anaconda prompt.
Set up the path to where code is located inside the repository cloned file, using the command:
> cd "C:\Users\<username>\...\InfraFair\InfraFair".
Run the model with the following command:
> python InfraFair.py
The model will ask you for the (<dir>) input, click Enter and leave it on the default value.
The model will ask you for the (<case>), enter the following command:
> Input Case Name (Default Examples\Simple_ex\Simple_Example): Examples\EU_ex\EU_Example
The model will ask you for the (<config_file>) input, click Enter and leave it on the default value.
Note
The Assets attributes tab must include all the lines in the flow tab, including duplications.
Once the model finishes execution, the figure below should be displayed in the command or Anaconda prompt.
Results#
The following table shows the cost allocated to countries’ generators (columns) based on their use of other countries’ assets (rows). The diagonal costs reflect the cost that a country has to pay itself according to the use of its own generators. The row “Cost to receive” indicates per country the total cost it should receive due to other countries’ generators using its assets (which is the sum of the country’s row minus the cost it should pay itself). The row “Cost to pay” indicates per country the total cost it should pay due to the use its generators are making of other countries’ assets (which is the sum of the country’s column minus the cost it should pay itself).
- Generation results
Country
ZB
ZG
ZI
DB
DD
DE
DF
DI
DJ
EA
EB
EC
ED
EF
EG
EH
EI
FF
ZB
236462
22598
4321
0
0
0
0
0
0
0
0
0
0
0
0
0
0
0
ZG
499
18705
0
0
0
0
0
0
0
0
0
0
0
0
0
0
0
0
ZI
723
0
599871
0
0
0
0
0
0
0
0
0
0
0
0
0
0
0
DB
0
0
20149
214977
9491
93
1
0
0
543
1123
0
0
0
1628
420
0
0
DD
0
0
7478
0
34546
3412
272
0
0
0
2563
0
0
0
0
0
0
0
DE
0
0
12913
0
7977
246952
28756
0
0
0
4783
2450
0
0
0
0
0
0
DF
0
0
1518
0
1094
13250
67513
0
0
0
0
1610
414
0
0
0
0
0
DI
0
0
4884
0
0
0
12
82918
2562
0
0
0
0
0
0
0
0
0
DJ
0
0
275
0
0
1788
18814
7210
54265
0
0
0
0
0
0
0
0
0
EA
0
0
0
0
0
0
0
0
0
1809
1139
0
0
0
1181
117
0
0
EB
0
0
0
0
0
531
0
0
0
0
29865
2553
0
0
0
47
473
0
EC
0
0
0
0
0
0
0
0
0
0
0
1471
0
0
0
0
4
0
ED
0
0
0
0
0
0
4520
0
0
0
0
0
206162
0
0
0
0
0
EF
0
0
0
0
0
0
0
0
0
0
0
0
0
3151
1839
0
0
0
EG
0
0
0
0
0
0
0
0
0
418
130
0
0
321
2831
132
0
0
EH
0
0
0
0
0
0
0
0
0
0
31
102
0
0
0
15594
1554
675
EI
0
0
0
0
0
0
0
0
0
0
0
1119
1038
0
0
0
15805
1010
FF
0
0
0
0
0
0
0
0
0
0
0
0
0
0
0
392
4
241
Cost to receive
26919
499
723
33448
13725
56879
17886
7458
28087
2437
3605
4
4520
1839
1000
2361
3167
396
Cost to pay
1222
22598
51539
0
18563
19074
52374
7210
2562
960
9770
7834
1452
321
4647
1107
2036
1684
Net compensation
25698
-22099
-50816
33448
-4838
37804
-34488
248
25525
1477
-6165
-7829
3068
1518
-3647
1254
1131
-1288
Similarly, the following table shows the cost allocated to the countries’ demand (columns) based on their use of other countries’ assets (rows).
- Demand results
Country
ZB
ZG
ZI
DB
DD
DE
DF
DI
DJ
EA
EB
EC
ED
EF
EG
EH
EI
FF
ZB
262666
317
399
0
0
0
0
0
0
0
0
0
0
0
0
0
0
0
ZG
1054
18150
0
0
0
0
0
0
0
0
0
0
0
0
0
0
0
0
ZI
2600
0
584641
5763
1810
1057
10
4711
1
0
0
0
0
0
0
0
0
0
DB
0
0
0
248425
0
0
0
0
0
0
0
0
0
0
0
0
0
0
DD
0
0
0
14759
31659
1852
1
0
0
0
0
0
0
0
0
0
0
0
DE
0
0
0
609
958
280593
18862
275
2535
0
0
0
0
0
0
0
0
0
DF
0
0
0
238
56
20227
61440
175
2547
0
0
0
717
0
0
0
0
0
DI
0
0
0
0
0
0
0
81576
8801
0
0
0
0
0
0
0
0
0
DJ
0
0
0
0
0
0
0
5552
76799
0
0
0
0
0
0
0
0
0
EA
0
0
0
712
0
0
0
0
0
3123
0
0
0
0
412
0
0
0
EB
0
0
0
1780
1245
6726
11
0
0
1530
21966
0
0
0
195
17
0
0
EC
0
0
0
0
0
853
100
0
0
0
521
0
0
0
0
1
0
0
ED
0
0
0
0
0
0
413
0
0
0
0
856
207684
0
0
0
1729
0
EF
0
0
0
0
0
0
0
0
0
0
0
0
0
4053
936
0
0
0
EG
0
0
0
955
0
0
0
0
0
267
0
0
0
519
2090
0
0
0
EH
0
0
0
284
0
0
0
0
0
13
429
0
0
0
520
16709
0
0
EI
0
0
0
0
0
0
0
0
0
0
615
9
0
0
0
3318
15030
0
FF
0
0
0
0
0
0
0
0
0
0
0
0
0
0
0
637
0
0
Cost to receive
716
1054
15952
0
16612
23237
23960
8801
5552
1124
11504
1476
2998
936
1742
1247
3942
637
Cost to pay
3653
317
399
25100
4069
30716
19396
10714
13883
1811
1566
865
717
519
2063
3974
1729
0
Net compensation
-2937
737
15553
-25100
12543
-7478
4563
-1913
-8330
-687
9939
611
2281
417
-321
-2727
2213
637
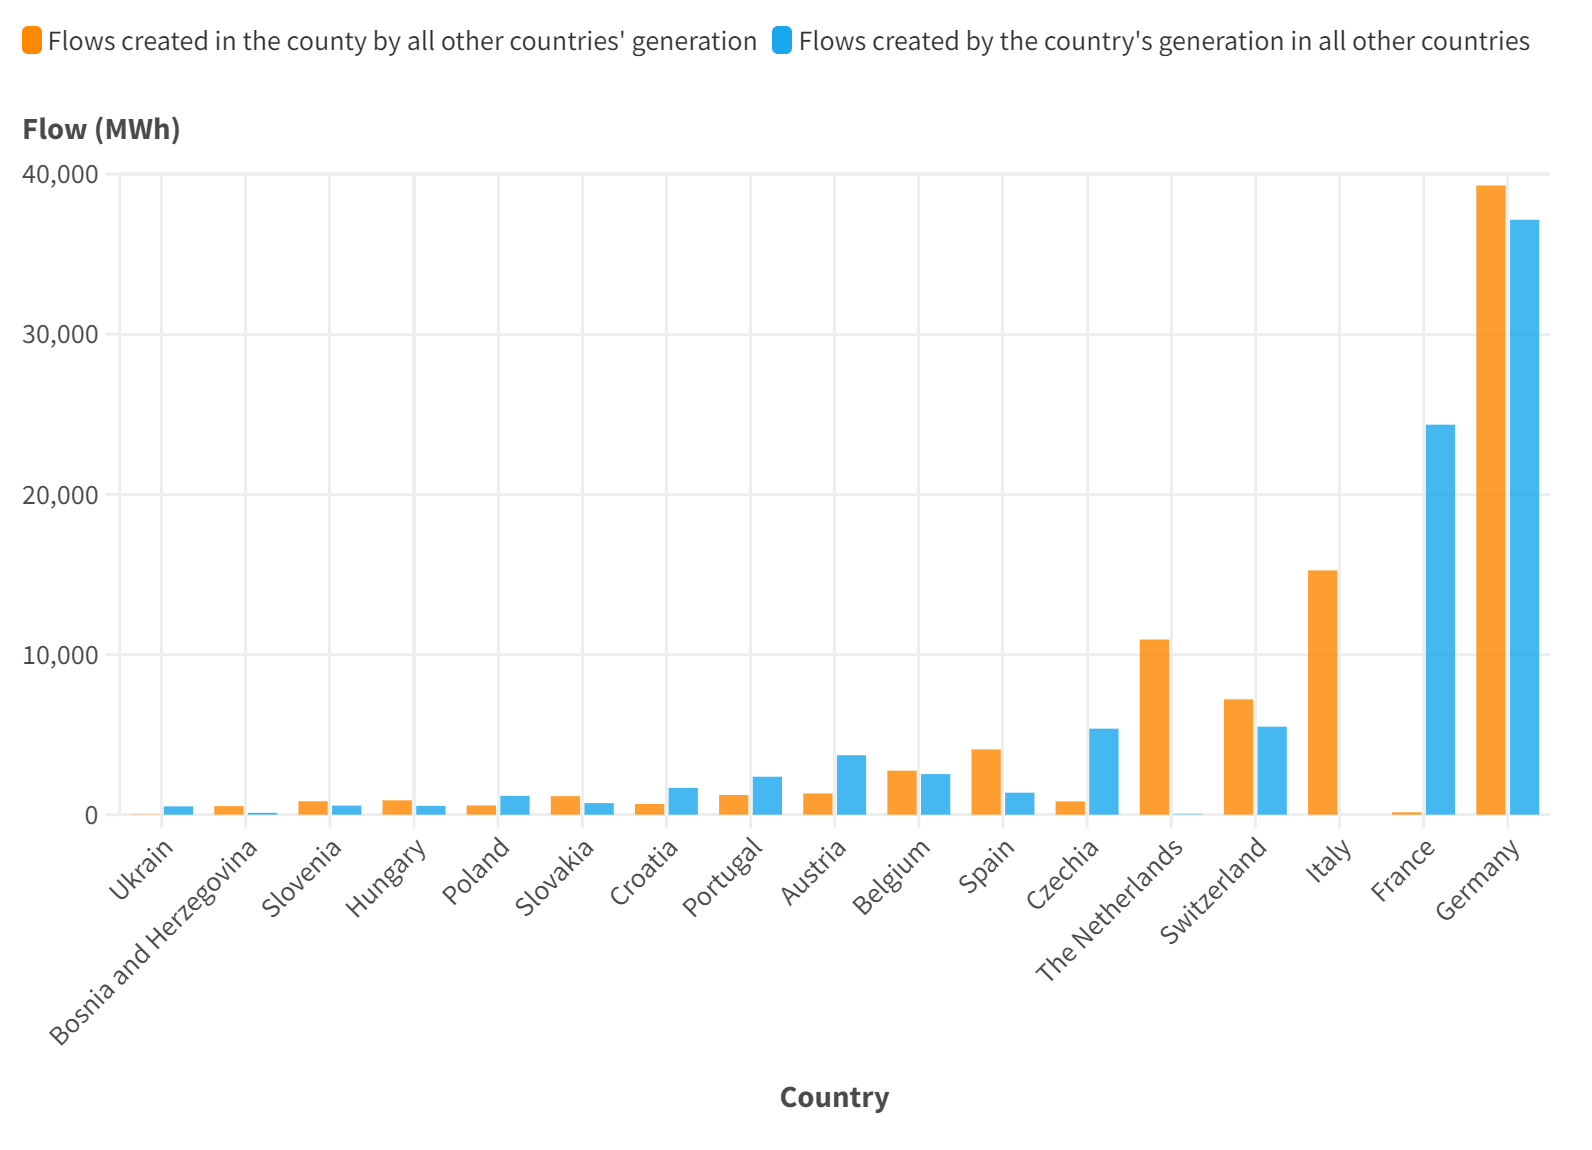
The figures below were created from the row results above using Flourish data visualization. They show the ranking of countries based on both their use of other countries’ network and the use that other countries make of their network.